Advertisement

Malta with lower than average household consumption in the EU

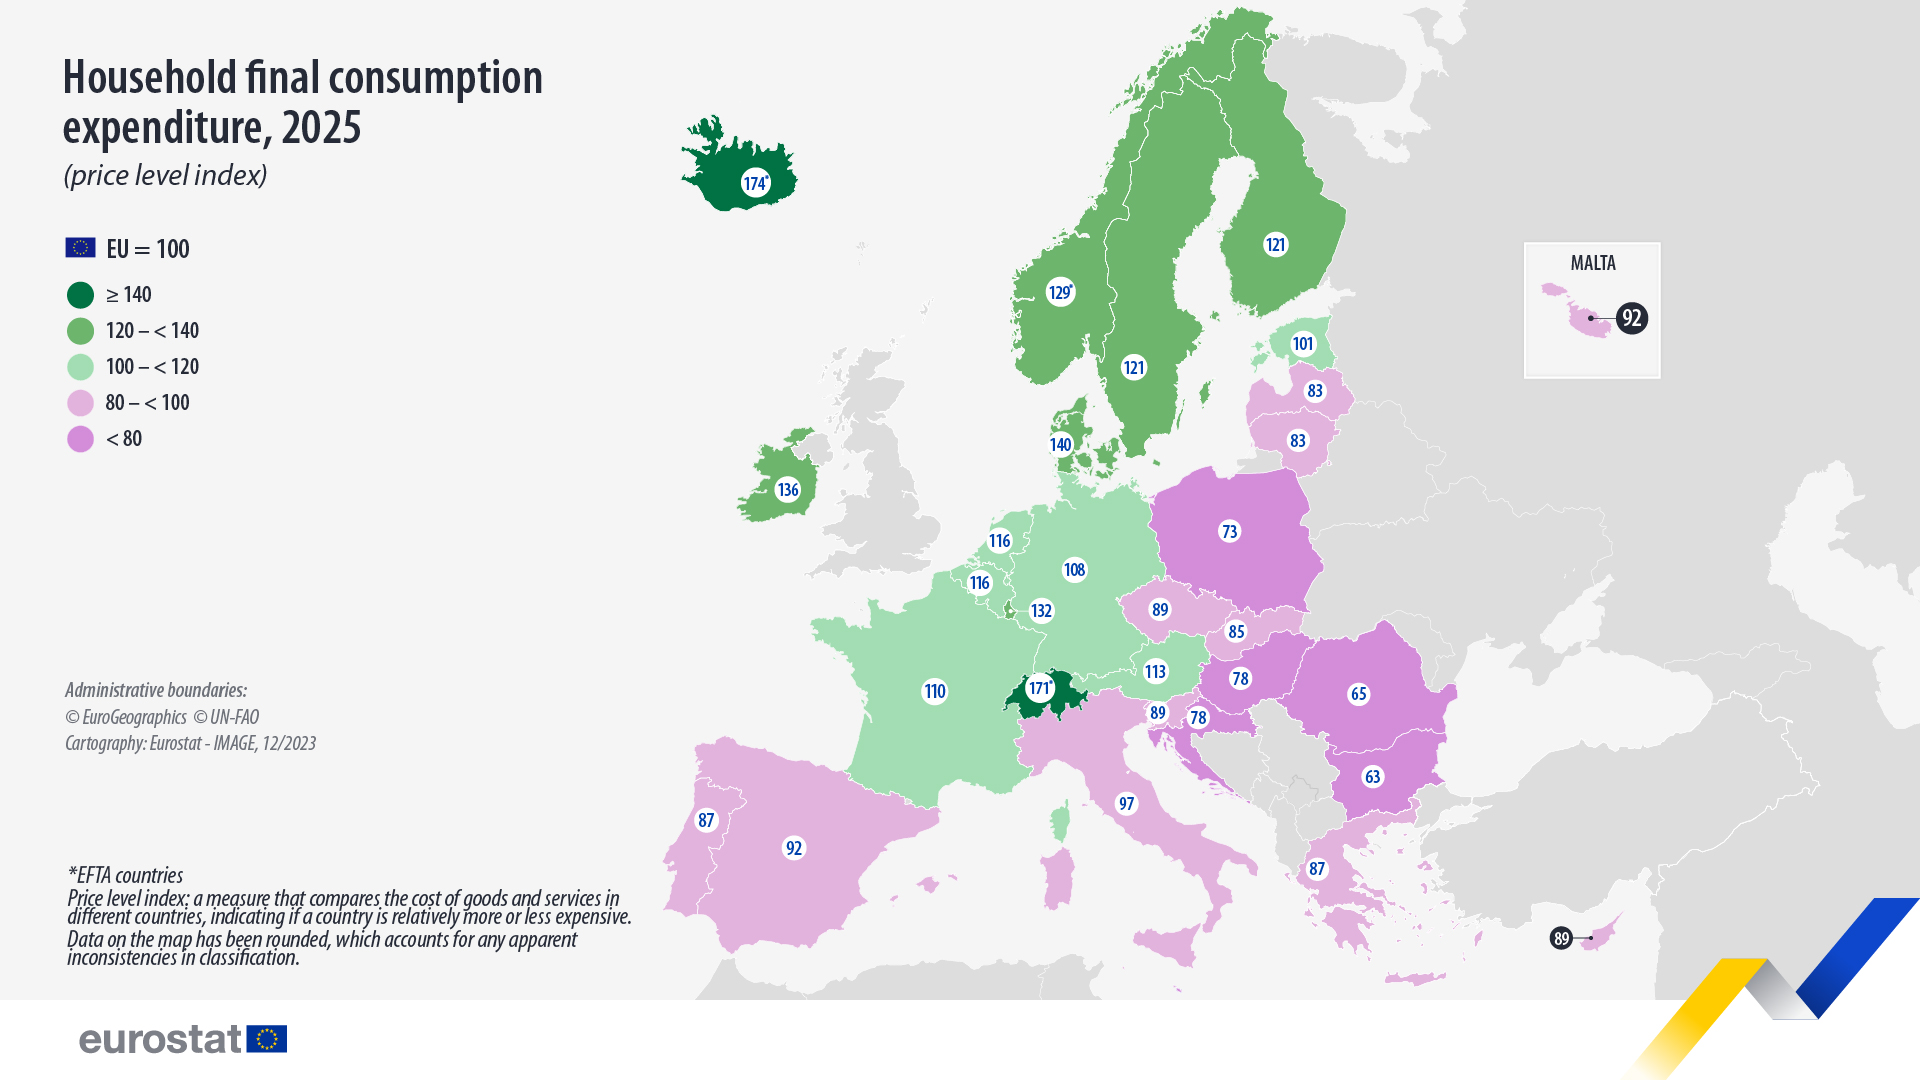
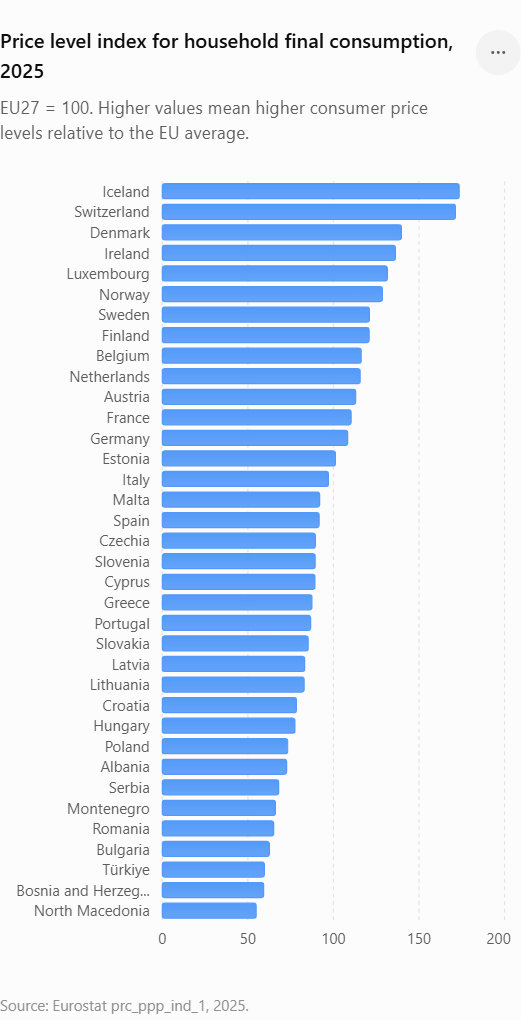
According to Eurostat, Malta has a slightly lower price level for household final consumption expenditure than the EU average, standing at 91.1 points compared with the EU benchmark of 100.

This means that household consumer goods and services in Malta were, on average, around 8.9% cheaper than the EU average. Malta therefore sits below the EU average, but not among the cheapest member states.

Across the EU, the highest household consumption price level was recorded in Denmark, where prices stood 40% above the EU average. At the other end of the scale, Bulgaria recorded the lowest price level, 37% below the EU average.

The figures show that while Malta remains relatively cheaper than several northern and western European economies, it is no longer a low-cost country by EU standards. It sits in the middle range of EU price levels, cheaper than the blocโ€™s most expensive economies but still well above the cheapest member states.


Comments

One response to “Malta with lower than average household consumption in the EU”

  1. Bastjan avatar

    These statistics are meaningless.

    Sure, they give a general indication of things, and have value in that limited sense. Nothing beyond that.

    Malta quite often sits quite high in terms of income and cost of living (or, rather, low – in any case, “positively”) and purchasing power, etc.

    Firstly, these statistics are not compiled equally. It is, admittedly, a daunting task, but, given the different authorities and countries involved, the statistics are usually not gathered in the same way. Many times, they are missing entirely (this is at times even indicated in the report itself, at least).

    Secondly, they ignore various factors, including those related enough without which the numbers are meaningless. For instance, quality of goods. Often, a good is represented by a category (so, “staple food”, “housing”, “mobile devices”, etc). There is a world of difference between the latest iPhone and a second-hand Chinese non-brand android device. Just as there is a huge difference between a properly insulated apartment and a concrete chicken coop.

    Thirdly, services are even worse. Sure, we get cheap services. Unfortunately, in all senses.

    Fourthly, and not related to this particular survey, other statistics (like standard of living, for instance) fail to take into account the different expectations. Some people have it so bad they are happy to afford a weekly Pizza. Others expect one yearly holiday abroad at a minimum, and, in most statistical surveys I have encountered, this is never taken into account.

    Just some things to keep in mind when assessing these studies, which nevertheless remain useful, as long as one takes them with a pinch of salt. Which is easier for us, given that it is on average 8.9% cheaper.

Leave a Reply

Your email address will not be published. Required fields are marked *